This visualises the data of sound. It responds visually to the peak and troughs of the frequencies of sound. It is an accurate and authentic representation but very uncreative or aesthetic as it is information.
https://www.youtube.com/watch?v=QHUiXoAG2Wo
This is an example as bars of frequencies low to high
https://www.youtube.com/watch?v=eGbkT2noz2I
This is linear, of soundwave frequencies.
https://www.youtube.com/watch?v=WF34N4gJAKE&feature=youtu.be&fbclid=IwAR1qIk9tyO5zwJtPS3YZalr0V6s-PHTKUZWAs-oKidZO2GOeK3pbANrEVOc
This video responds visually to the music. It picks out the different sounds and creates a world through collaging all the sounds together to create the whole.
Like music is a collection of sounds in time, the video is a collection of images in time.
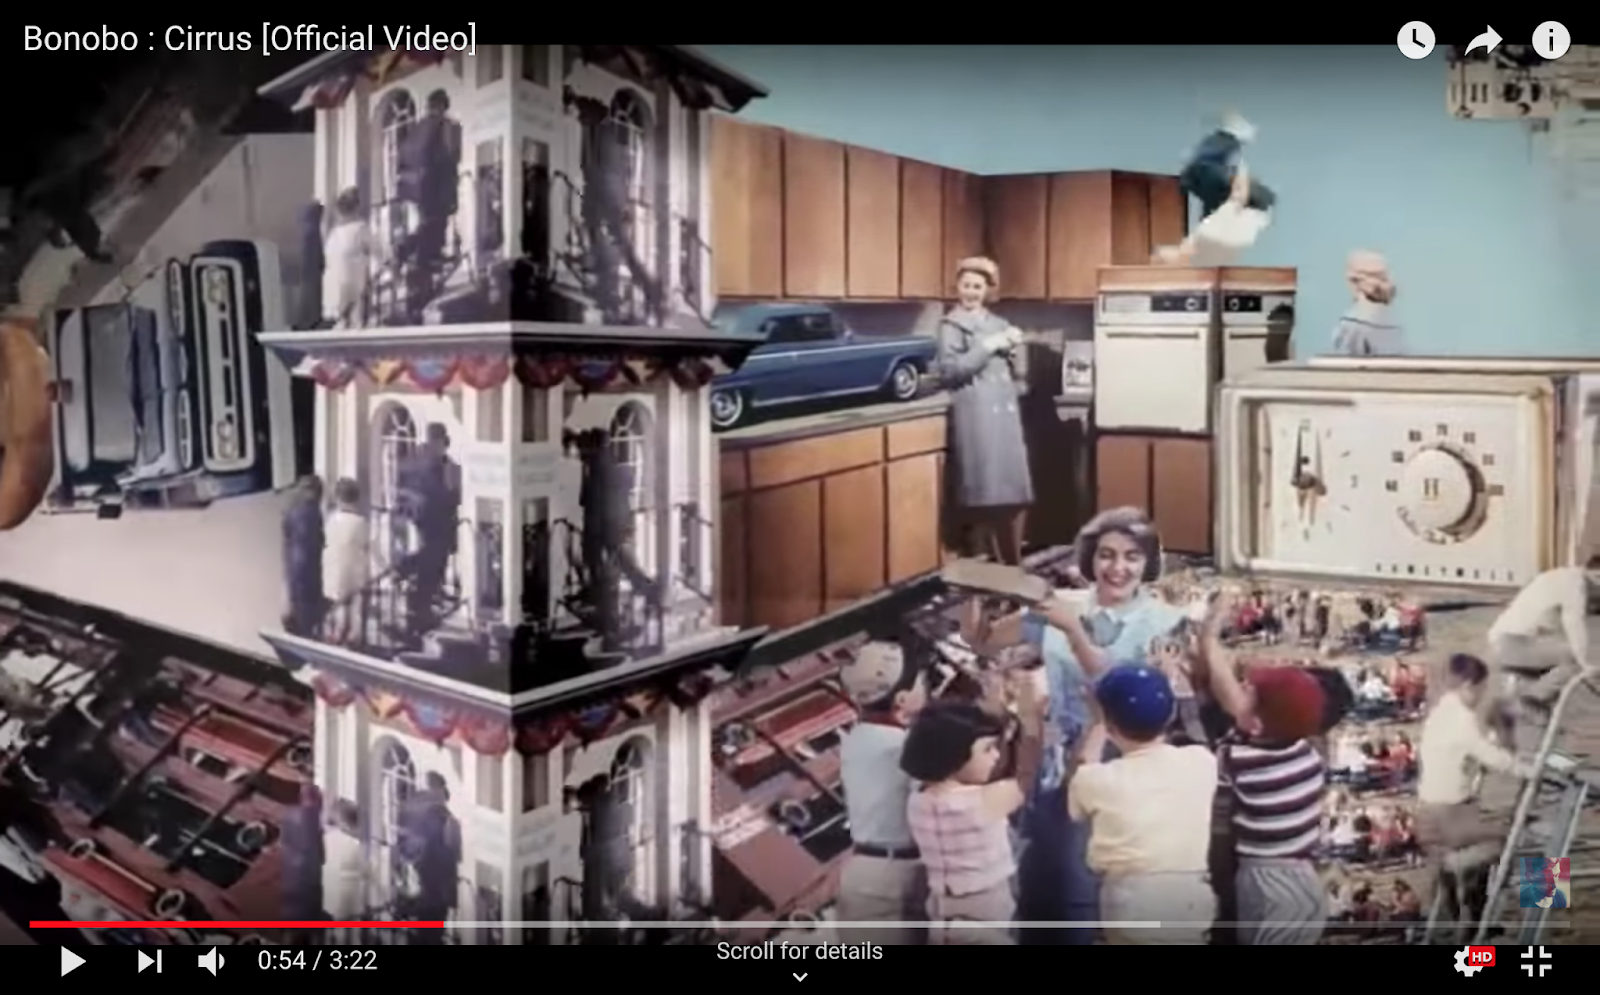 |
| For example this scene in particular is a moving collage of actions reflecting individual sounds and parts of the music. |
No comments:
Post a Comment